


Global Waste Index 2019
The biggest waste producers worldwide
In September 2018, the World Bank announced that our global waste production is predicted to rise by 70 per cent by 2050 unless we take urgent action. Humankind currently produces two billion tonnes of waste per year between 7.6 billion people. Population increase may be part of the problem, but it’s levels of consumption within a handful of developed nations, and their gross mismanagement of waste, that have led to this environmental catastrophe. The United States is the biggest generator of waste per capita worldwide, with each citizen producing an average of 808 kilograms per year – almost a tonne – and more than double that of citizens of Japan. However, as the Global Waste Index highlights, it’s not just the generation of waste that will threaten our planet in the upcoming decades – but the way we choose to manage it.
The Global Waste Index offers a comprehensive breakdown of the most environmentally-friendly methods of waste management. It ranks the 36 countries within the Organisation for Economic Co-operation and Development (OECD) according to how effectively they manage their waste per capita.
How much waste is produced each year in the world? Which are the top 10 countries that produce the most waste in 2019? Find out below in global waste statistics 2019.
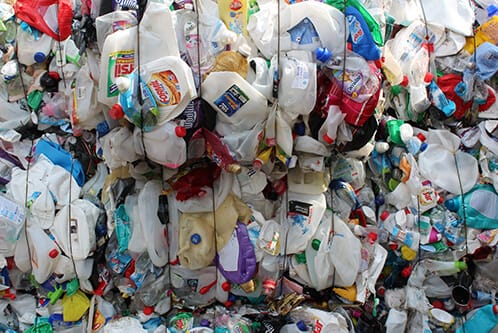
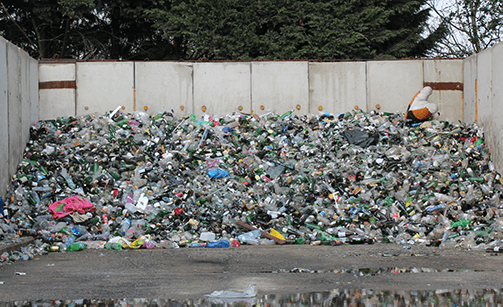
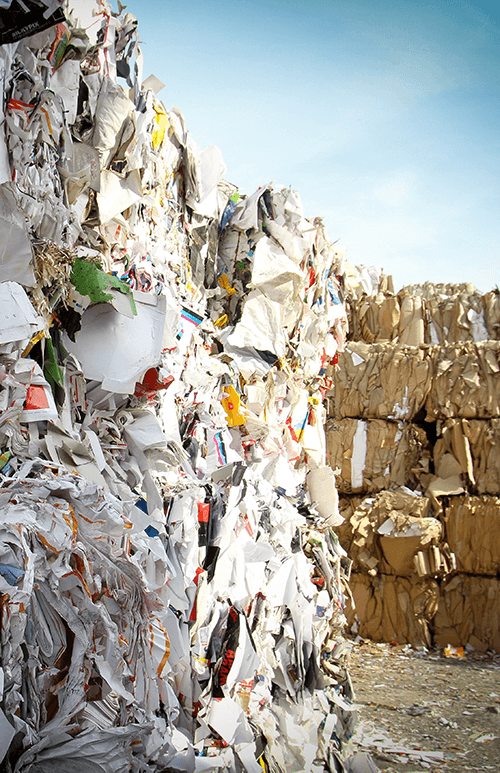

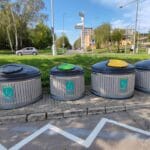
Recycling, the process of converting rubbish into new materials, is the best method for managing waste; while incineration, the process of controlled combustion used to turn waste into energy, is considered far more favourable than landfill sites and illegal dumping. Each country was scored according to the kilograms of waste it processes every year using each of these techniques – as well as per capita waste generated, and kilograms of waste unaccounted for.
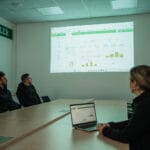
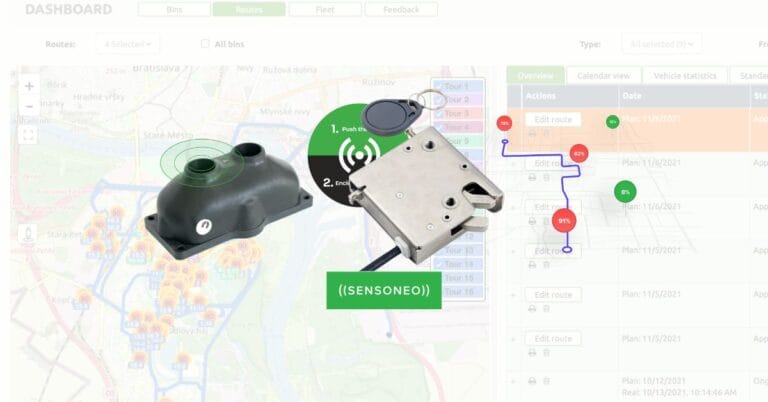
At Sensoneo, we’re redefining smart waste management. Our solution combines unique inhouse-produced Smart Sensors that monitor waste real-time with sophisticated software and applications, providing cities and businesses with digital waste transformation, data-driven decision making, and optimization of waste collection routes, frequencies and vehicle loads. This leads to reduced traffic congestion, greenhouse gas emissions, and, most importantly, it enables us to work together to keep our cities litter-free.
It’s time for an investment in waste management methods that prioritise the health of our planet. At Sensoneo, we believe we’ve taken the first step.
The Global Waste Index is a comparative analysis of per capita waste management across the 36 countries within the Organisation for Economic Co-operation and Development (OECD). Here you can find the full methodology and sources used.
GWI 2019 ranks countries in descending order, starting with those performing the worst, based on the most recent data available in each country. Click on the table headers to sort by generated waste, recycling, incineration, landfill, open dump or unaccounted waste. All values represent kilograms per capita per year.
The final scores were standardised from 0 to 100, with 0 being the lowest score, indicating the country worst at managing waste; and 100 the highest, indicating the country best at managing waste.
Final ranking
Metodology
The main sources for the study:
1. Country Level Code Book and Country Level Dataset
The World Bank, ‘What A Waste’ Global Database (1993 – 2017). OECD country-level data is largely available from 2016 onwards.
2. Municipal Waste Statistics
The European Union ‘Municipal Waste Database’ (2016 – 2017).
3. National Waste Report 2018
Australian Department of Environment and Energy (2018).
Factors
On a per capita level, we uncovered the amount of waste in each country that ends up recycled, incinerated, on a landfill site, on an open dump, or unaccounted for – i.e. untraced – over a year.
- Waste Generated Per Capita: the kilograms of waste produced per person.
- Recycled: the kilograms of waste converted into new materials.
- Incineration: the kilograms of waste disposed of via controlled combustion.
- Landfill: the kilograms of waste disposed of via burial. All types of landfill site were included (unspecified, sanitary, controlled).
- Open dump: the kilograms of waste dumped illegally.
- Unaccounted: the kilograms of untraceable waste.
Scoring
This index aims to identify the most environmentally-friendly countries for waste management. Therefore, each of the factors/techniques was allocated a number of positive or negative points relative to the amount of CO2 emissions and environmental contamination it causes on average.
- Waste Generated Per Capita: Waste generated per capita is considered a negative factor, a country could lose up to 3 points for its amount of waste produced per person (calculated according to waste produced on a country level / total population).
- Recycling: Recycling is considered a positive technique, a country could obtain up to 4 points for the amount of waste recycled.
- Incineration: Incineration is considered a positive technique, a country could obtain up to 1 point for its amount of waste disposed of via incineration.
- Landfill: Landfill considered a negative technique, a country could lose up to 3 points for its amount of waste disposed of via landfill sites.
- Open Dump: Open Dump is considered an extremely negative technique, a country could lose up to 6 points for its amount of waste illegally dumped.
- Unaccounted: Unaccounted waste is considered an extremely negative technique, a country could lose up to 6 points for its amount of untraced waste. The differently weighted factors were normalized to a scale of 0 – 10 to make them comparable.
Available for download
Global Waste Index 2019 – Methodology
About the company
Sensoneo is a global technology company providing innovative solutions for waste management. Through the integration of cutting-edge technology, including robust software and a data-driven approach, Sensoneo enables cities, businesses, and countries to enhance their sustainability performance, optimize waste collection processes, and lower their environmental footprint.
Latest waste library articles
-
 DRS
DRSInterview on Deposit Return Schemes with Sensoneo CEO Martin Basila
Read more -
 DRS
DRSSlovak Deposit Return System highlighted at RWM in Birmingham
Read more -
Smart Waste
3 smart waste solutions for making the waste collection an effective process
Read more -
 Sensoneo
Sensoneo announced a series A investment of more than 6 million euros
Read more

-
DRS
Interview on Deposit Return Schemes with Sensoneo CEO Martin Basila
Read more -
DRS
Slovak Deposit Return System highlighted at RWM in Birmingham
Read more -
Smart Waste
3 smart waste solutions for making the waste collection an effective process
Read more -
Sensoneo
Sensoneo announced a series A investment of more than 6 million euros
Read more
Smart Waste Newsletter
Get monthly updates from our company and the world of waste!