


Global Waste Index
The Global Waste Index by Sensoneo is a comparative analysis of per capita waste management across the 38 countries within the OECD.
2025
Global Waste Index
The Global Waste Index by Sensoneo is a comparative analysis of per capita waste management across the 38 countries within the OECD.
GWI 2022
With this year’s new edition of the Global Waste Index, we want to draw attention to the enormous waste problem in the world.
GWI 2019
First edition of the comprehensive breakdown of the biggest waste producers worldwide.
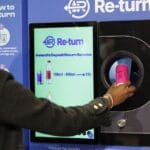
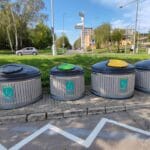
Overview and results of Deposit Return Schemes in Europe
The current state of DRS implementation can be divided based on 3 factors: DRS implemented, legislation adopted and ongoing discussions.
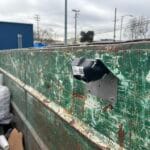
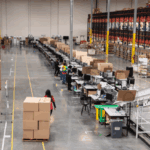
Growing volumes of municipal solid waste in the United States
New data on municipal solid waste (MSW) per capita reveals major differences in waste generation by state.
The great recycling myth I.
This article explores the complexities and limitations of plastic recycling, clarifying the difference between sorting and actual material recovery.
The great recycling myth II.
In this article, we will focus on other ways and tips that have the potential to truly transition a linear economy into a circular economy.
More from Sensoneo
Explore all our resources, projects and solutions.
Get in touch with us
Interested in our Global Waste Index? Leave us your details and questions and we will answer you shortly.
Say yes to ![]()
Through the integration of innovative technology including robust software, durable hardware, and a data-driven approach, we support the digital transformation of waste management to achieve efficiency, transparency, and sustainability.
Sensoneo is a global provider of innovative technology solutions that support the digital transformation of waste management to achieve efficiency, transparency, and sustainability and facilitate the transition to the circular economy. With a team of more than 160 professionals and an active presence across Europe, the United States, the MENA region, and Southeast Asia, Sensoneo supports waste professionals, Deposit Return Scheme operators, and Producer Responsibility Organisations in managing waste more efficiently.
Over the years, Sensoneo has been expanding and perfecting its portfolio, which now ranges from waste monitoring and logistics optimisation to end-to-end take-back systems, IT solutions for PRO and EPR, and comprehensive IT systems running nationwide deposit return schemes. Sensoneo has successfully implemented and operated IT systems for Deposit Return Schemes (DRS) in
9 countries, achieving recycling performance exceeding 90%. Sensoneo’s deployment of smart sensors contributes to the largest smart waste installation worldwide, encompassing an impressive 11,100 sensors in Madrid.
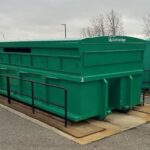
Sensoneo solutions help the largest factories and logistics centres to automate industrial waste collection, enabling full transparency over the waste streams managed and accurate data reporting necessary for ESG.
Smart Waste Newsletter
Get monthly updates from our company and the world of waste!